

Study population
The HUNT Study is a large, population-based health study that has been conducted in four phases: HUNT1 (1984–1986), HUNT2 (1995–1997), HUNT3 (2006–2008), and HUNT4 (2017–2019) in Trøndelag County, Norway23,24. All adults aged 20 years or older were invited to complete general self-reported questionnaires on socio-demographics, lifestyle factors, clinical conditions/diseases, and underwent clinical examinations23,24.
A sub-study on oral health was conducted as part of the HUNT4 survey. A random sample of 7347 adults from HUNT4 (20% of the population) was invited to participate in the HUNT4 Oral Health Study4,23. Participants in the HUNT4 Oral Health study were aged ≥ 20 years. Among them, 4929 adults underwent clinical and radiographic examinations for dental caries (Fig. 1). Edentulous individuals were excluded (n = 32). Additionally, individuals with missing information on study exposures, such as BMI (n = 12) and PA (n = 114), were excluded, resulting in a final study population of 4752 adults. This sample provides a representative subset of the general adult population in Trøndelag County.
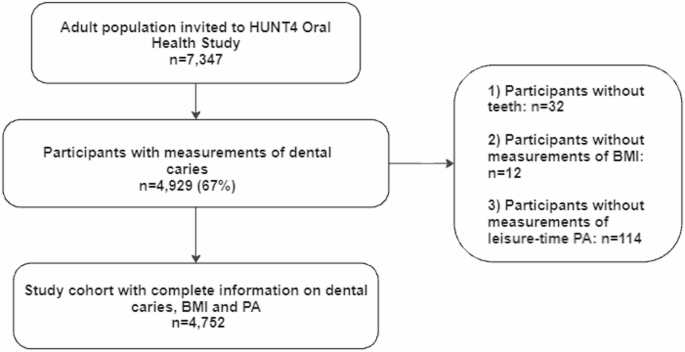
Flow chart of the study population.
Exposures
Measurements of BMI
In all the HUNT surveys, body weight and height were measured by health professionals at the time of clinical examination. Height was measured to the nearest centimeters, and weight was measured to the nearest 0.5 kg. BMI was calculated as weight in kilograms divided by height squared in meters (kg/m2). Following the WHO recommendation, BMI was further categorized into underweight (< 18.5 kg/m2), normal weight (18.5–24.9 kg/m2), overweight (25–29.9 kg/m2), and obese (≥ 30 kg/m2)25. Due to the small number of underweight individuals (n = 36), the underweight and normal weight categories were combined into a single group.
Combination of BMI and PA.
In all the HUNT surveys, PA was self-reported average leisure-time PA based on questions about frequency, intensity, and duration: Question (1) “How frequently do you exercise?” with response scores of ‘never’ (0), ‘less than once a week’ (0.5), ‘once a week’1, ‘two to three times per week’ (2.5), and ‘almost every day’5. Question (2) “If you do such exercise as frequently as once or more times a week, how hard do you push yourself ?” with response scores of ‘I take it easy, I don’t get out of breath or break a sweat1, ‘I push myself until I’m out of breath and break into a sweat’2 and ‘I practically exhaust myself’3 and Question (3) “How long does each session last?’ with response scores of ‘less than 15 min’ (0.1), ‘15–29 min’ (0.38), ‘30 min to 1 h’ (0.75), and ‘more than 1 h’ (1.0). We calculated a PA summary score (PAS) by multiplying each participant’s score on the three questions. We chose to categorize physical activity based on the PAS, following the approach used in the previous HUNT study. This PAS was suggested to be reliable and valid26. The individuals who responded as never or less than once a week for the frequency of PA were those with no PA (PAS = 0). The remaining individuals were categorized into low PA (0 < PAS ≤ 1.90), medium PA (1.91 ≤ PAS ≤ 3.75), and high PA (3.76 ≤ PAS ≤ 15.00) based on tertile values of the PAS27. The individuals with no and low PA were further regarded as physically inactive, whereas individuals with moderate to high PA were regarded as active. We further classified the combination of BMI and PA into four groups: a) normal weight and physically active; b) normal weight and physically inactive; c) overweight/obese and physically active; and d) overweight/obese and physically inactive.
Outcome
Information on dental caries was extracted from The HUNT4 Oral Health Study. In brief, trained and calibrated dentists or dental hygienists registered all individuals’ caries experience via both clinical and radiographic bitewing examinations. Cohen’s kappa values for inter-examiner agreement during the clinical examinations ranged from 0.71 to 0.91 across the different field stations, indicating substantial to almost perfect agreement. Additionally, repeated evaluations of a standardized set of clinical intra-oral photographs were conducted at the beginning (kappa = 0.82) and later in the data collection period (kappa = 0.85) to assess inter-examiner reliability. Intra-examiner agreement, based on the same set of photographs, yielded kappa values ranging from 0.79 to 0.93. For radiographic caries assessment, inter-examiner reliability showed kappa values of 0.87 and 0.84 in the first and second calibration sessions, respectively, while intra-examiner reliability ranged from 0.84 to 0.87. A more detailed description for training and calibration of examiners has been published previously4.
Dental Caries was classified using the system developed by Amarante (1998)28, which is the standard diagnostic classification taught in all dental schools in Norway and commonly used in clinical practice. This system grades carious lesions on a scale from 1 to 5, based on visual and radiographic criteria. Grade 1 indicates discoloration without substance loss and no radiographic findings, while Grade 2 involves minimal enamel breakdown or caries confined to the enamel. In this study, we included only dentine caries, defined as Grades 3 to 5: lesions with moderate to severe substance loss and radiographic evidence of caries extending into the outer, middle, or inner third of the dentin. This corresponds to the WHO D3 threshold for cavitated dentine lesions. The total dental caries experience, number of decayed, missing, and filled teeth (D3MFT), was regarded as the main outcome. Number of teeth with untreated dentine caries (D3T) were defined as teeth with primary or secondary caries in dentine (caries registration grades 3–5) and root caries with cavitation4, based on clinical examination and bitewing radiographs4,28 and regarded as another main outcome. The missing teeth (MT) referred to all missing teeth regardless of the reason4. The filled teeth (FT) were restored teeth without secondary caries and include all types of filling materials and crowns4. In addition, the number of sound teeth (ST) were calculated and characterized by the absence of initial or dentine caries, filling and/or other restorations or bridge abutments28. Both MT and ST were used as secondary outcomes.
Covariates
All potential covariates in this study were collected via questionnaires at HUNT4. Age in years (continuous), sex (females, males), smoking status (never, former, and current), sugary drink intake (almost not, 1–6 glasses per week, and ≥ 2 per day).
Education and income level were categorized consistently with previous HUNT studies29,30. Education level, originally grouped in six categories from the questionnaire, was condensed into three groups (≤ 10 years, 11–14, and > 14 years) were included. Household years’ income before taxation, recorded in Norwegian Kroner (NOK), originally grouped into five categories in the questionnaire, were condensed into three groups (< 450,000 kr, 451,000-1000,000 kr and > 1000,000 kr). We used the original HUNT4 questionnaire categories for fruit intake and vegetable intake, each defined separately as: less than once, 1–3 times per week, 4–6 times per week, and daily. Based on these, we constructed a combined variable for ‘fruit or vegetable intake’ with three categories: ≤ 3 times per week, 4–6 times per week, and daily. Similarly, snus use ‘moist snuff’ was originally categorized as never, former, and current, but was recoded into two categories: ever users vs. never users. Diabetes status was assessed by asking, ‘Have you ever had, or do you currently have diabetes?’ with response options: Yes or No. Missing data for each variable were included in the analyses as an “unknown” category.
Statistical analysis
Descriptive statistics of the study individuals were provided, with means (SD) for continuous variables and frequencies (percentages) for categorical variables. The characteristics of the individuals were presented by BMI categories and by combinations of BMI and PA levels. We assessed the association between BMI levels, their combination with PA, and dental caries using negative binomial regression. To study the combined effect of BMI and PA on dental caries, four combined categories were constructed (normal weight and physically active as reference group, normal weight and physically inactive, overweight/obese and physically active, overweight/obese and physically inactive).
The ratio of means (RM) with 95% confidence intervals (CIs) was used to evaluate the associations. We employed negative binomial regression due to the count nature of the outcome variables and the potential for overdispersion31,32. In a cross-sectional setting, the mean number is increasing when RM > 1 while the mean number is decreasing when RM < 132. While assessing the association between exposure and outcome, the confounders were selected based on previous knowledge11,12,13,14,15. The adjusted model for the association between BMI and dental caries included the following confounders: age, sex, smoking status, sugary drink intake, PA, education level, and income level. We further examined the potential effect modification by age (< 65 vs. ≥ 65y) using the likelihood ratio test. Additionally, an alternative cut-off at age 55y was used to distinguish between the pre-fluoride and fluoride generations, reflecting differences in fluoride exposure during formative years, which may influence long-term oral health outcomes such as dental caries.
To test the robustness of the results, we: (i) further adjusted for additional confounders, including snus consumption (no, yes), fruit or vegetable intake (≤ 3 times per week, 4–6 times per week, and daily) and ever diabetes status (yes, no) for all the associations; (ii) used MT and ST as secondary outcomes; and (iii) redefined the combination groups into normal weight and active, normal weight and non-active, overweight/obese and non-active, and overweight/obese and active. All the statistical analyses were performed with STATA/SE 16.1 (College Station, TX, USA).
link